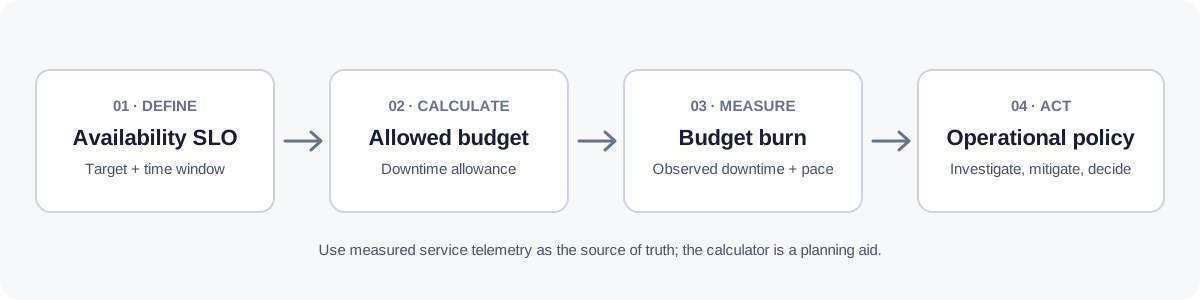
An availability target becomes useful when a team can translate it into an operational decision. An error budget makes that translation concrete: it expresses how much unreliability a service can consume during a defined window before the team needs to reconsider risk, releases or reliability work.
A service-level objective (SLO) is a target for a service-level indicator (SLI), such as successful requests or availability. The error budget is the amount of failure the objective permits over its measurement window. It is not a promise that incidents will fit neatly inside a monthly allowance, and it is not a substitute for monitoring. It is a shared way to discuss reliability using the same units.
This guide focuses on a time-based availability budget measured as downtime minutes. Request-based SLOs use failed-request counts or error ratios instead; the same ideas apply, but the calculation should use the SLI that the team has actually defined.
1. Convert the availability target into a budget
For a fixed window, a simple downtime budget is:
allowed downtime = window duration × (1 − target availability)
Use availability as a fraction in the formula. For example, 99.9% becomes 0.999. For a 30-day window:
- Window duration = 30 × 24 × 60 = 43,200 minutes.
- Allowed downtime at 99.9% = 43,200 × 0.001 = 43.2 minutes.
- Allowed downtime at 99.95% = 21.6 minutes.
- Allowed downtime at 99.99% = 4.32 minutes.
A small change in the target can materially change the allowed downtime. That does not mean a higher target is automatically better: a target should reflect user expectations, business impact, architecture, operating cost and the team's ability to measure the SLI accurately.
The SLO Error Budget Calculator lets you enter a target, a window, elapsed time and observed downtime. It calculates the allowance, remaining budget, burn rate and a simple linear projection in your browser.
2. Define what counts as downtime before counting it
The arithmetic is straightforward; the measurement contract is where teams can disagree. Before using an error budget to guide a release, document:
- The user-facing service boundary. Decide which endpoints, journeys or service components are in scope.
- The SLI measurement source. Use a consistent source such as synthetic checks, request telemetry or a service-level monitoring system.
- The failure definition. Decide how to treat partial failures, elevated latency, regional incidents and degraded but technically available responses.
- The time window. A rolling 30-day window and a calendar-month window produce different results near the boundary.
- Exclusions, if any. Make them explicit, narrow and auditable rather than removing inconvenient incidents after the fact.
A downtime-based calculator assumes the minutes you enter are the downtime counted by your SLI. It does not infer availability from raw logs, adjust for traffic volume, or decide whether a partial outage counts as a full minute. Those rules belong in the SLO definition and monitoring implementation.
3. Read burn rate as pace, not as a prediction
Budget consumption alone does not show whether the service is spending its allowance unusually quickly. Burn rate compares the fraction of the budget already consumed with the fraction of the window that has elapsed:
burn rate = budget fraction consumed ÷ window fraction elapsed
A burn rate of 1× means the service has consumed budget at the same pace as the window has elapsed. A value above 1× means it is spending budget faster than a straight-line pace; below 1× means it is spending it more slowly so far.
Consider a 30-day, 99.9% SLO with 43.2 minutes of allowed downtime:
- By day 10, 12 minutes of counted downtime consume about 27.8% of the budget. One-third of the window has elapsed, so burn rate is about 0.83×.
- By day 10, 24 minutes consume about 55.6% of the budget. Burn rate is about 1.67×. If the same average downtime per day continued, the simple projection would be 72 minutes for the window—above the 43.2-minute allowance.
That projection is a warning signal, not a forecast. Incidents cluster, traffic changes, fixes take effect and measurement windows roll forward. Use it to prompt investigation, not to claim a precise future outage total.
4. Turn the number into an operating policy
A budget is valuable when it changes how a team makes decisions. Agree on a policy before a major incident, rather than inventing one under pressure. A practical starting point might be:
| Signal | Possible response |
|---|---|
| Budget is healthy and burn is low | Continue normal delivery while maintaining standard release checks. |
| Burn rate rises sharply | Check alert quality, recent changes, dependency health and user impact; use fast-burn alerts for urgent investigation. |
| A linear projection shows likely budget exhaustion | Review risky releases, prioritise reliability work and agree who can accept further risk. |
| Budget is exhausted | Follow the team's documented policy for pausing or limiting non-essential risky changes until the service is stable. |
These are examples, not universal rules. A critical payment flow, an internal reporting service and a low-risk informational page may reasonably use different policies. The important point is that the policy is explicit, proportionate and agreed by engineering and product stakeholders.
5. Pair budget tracking with the right alerts
Monthly budget views help with planning, but they can hide a severe short incident. Alerting should consider both the rate of budget consumption and the duration of the signal. A fast-burn alert can identify a serious regression quickly; a slower-burn alert can catch persistent degradation that might otherwise remain below a short-window threshold.
Keep the alert tied to the SLI and its measurement source. If the SLO is request-based, calculate failed requests against eligible requests rather than converting everything to downtime minutes. If latency is part of the objective, define the latency threshold and the population of requests before using it in the budget.
When an alert fires, the response should connect telemetry to action: identify the affected user journey, compare the signal with recent deployments and dependency changes, mitigate the impact, then record what the incident consumed and what should change.
6. Use estimates responsibly
The calculator is intended for planning and review, not for real-time SLO monitoring. It assumes one availability target and one measurement window, and it treats observed downtime as a single total. It does not calculate multi-window burn-rate alerts, request-weighted availability, latency objectives, maintenance exclusions or regional weighting.
Use production telemetry as the source of truth. Validate the SLI definition, confirm that the monitoring window matches the policy, and compare the estimate with the service's actual error-budget report before using it to approve a change.
For broader capacity questions—request rate, peak throughput, network bandwidth and storage growth—use the separate System Design Capacity Calculator. Capacity estimates and reliability budgets answer different questions: one estimates workload demand; the other makes reliability risk visible.
For a workload-specific example of protecting a critical state transition under bursty traffic, read Handling Concurrent Bids in a Real-Time Auction System. It connects lock contention, request retries and post-commit delivery to the operational signals a team should monitor.
A useful outcome
A good SLO is not just a percentage on a dashboard. It gives the team a measurable boundary for discussing user impact, operational risk and delivery choices. Define the indicator, make the budget arithmetic transparent, interpret burn rate in context, and agree on actions before the budget is under pressure. That is how a simple allowance becomes a practical reliability practice.