# Network Infrastructure Capacity Planning: Bandwidth, Concurrency and Headroom
Capacity planning is often reduced to a single bandwidth number. In practice, a reliable estimate starts with the workload: how many requests arrive, how large they are, how long they remain active, how traffic changes during peaks, and which parts of the system share the same network path.
A useful network infrastructure load calculation does not predict the future perfectly. It makes assumptions explicit, identifies the likely bottleneck, and gives the team a repeatable way to validate those assumptions with measurements.
This guide presents a practical approach for web applications, APIs, internal services and cloud-hosted platforms. The examples are illustrative; replace them with measurements from your own application before making procurement or production-sizing decisions.
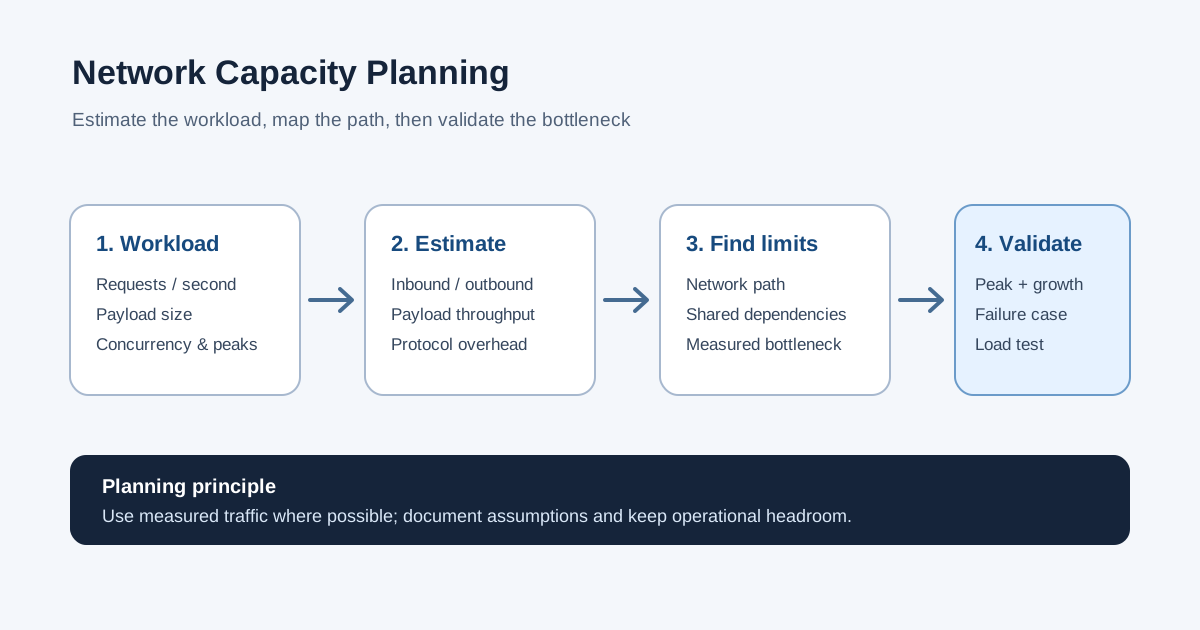
1. Start with the workload, not the link speed
Before selecting a network interface or estimating bandwidth, write down the workload you need to support.
At minimum, capture:
- Request rate: average and peak requests per second (RPS), including background jobs and service-to-service calls.
- Payload size: average request and response bytes, plus the distribution of unusually large responses.
- Concurrency: active users, open connections and requests being processed at the same time.
- Traffic shape: normal hours, predictable bursts, scheduled jobs and seasonal peaks.
- Response behavior: caching, compression, retries, streaming and long-lived connections.
- Availability target: what happens during a node failure, zone disruption, deployment or dependency slowdown.
Do not treat registered users as concurrent users. A portal with many registered accounts may have only a small fraction active at once, while a real-time dashboard can keep connections open for long periods. Estimate each workload using its actual behavior.
If reliable telemetry is available, use it as the baseline. If it is not, label assumptions clearly and validate them with a representative load test rather than presenting the estimate as a measured fact.
2. Estimate bandwidth from request rate and payload size
A first-order estimate of application payload throughput is:
payload bits per second = requests per second × average payload bytes × 8
For example, assume a service handles 250 requests per second and the average response payload is 40 KB (using decimal kilobytes for this illustration).
- Payload throughput = 250 × 40,000 × 8 bits per second
- Payload throughput = 80,000,000 bits per second, or 80 Mbps
This is an estimate of response payload throughput, not a complete interface-capacity requirement. It excludes request payloads, protocol overhead, retransmissions, TLS and transport behavior, other services sharing the link, and bursts above the assumed average.
Calculate inbound and outbound directions separately. Many systems send much more data to clients than they receive, while upload, backup and replication workloads can reverse that pattern.
Use peak rates, not only averages
Suppose daily averages are low but a scheduled report causes a short burst. Sizing exclusively from the daily average can hide the peak that determines user experience.
Use measured peak windows where possible. If only an average is available, document the peak-to-average assumption and test the result. Avoid applying an arbitrary multiplier without explaining what workload behavior it represents.
3. Convert concurrent users into request load carefully
Concurrent users are not the same as requests per second. A rough model is:
RPS ≈ active users × average requests per user per second
If 1,000 users are active and each generates an average of one request every 10 seconds, the simplified estimate is approximately 100 RPS. This assumes a stable average and does not model synchronized bursts, background polling, retries or user actions that trigger several API calls at once.
For interactive applications, inspect the request pattern:
- Does each page load trigger several API calls?
- Does the browser poll every few seconds?
- Do users upload files or download reports?
- Are WebSocket connections long-lived but low-volume?
- Can a reconnect cause a burst of subscription or snapshot requests?
A useful model separates page-load traffic, steady-state activity, background processing and reconnect behavior. That separation helps identify whether the network, application CPU, database or a downstream dependency is likely to constrain throughput first.
4. Include protocol and delivery overhead
Payload throughput is only one layer of the calculation. Real network traffic also includes headers and transport behavior. The difference depends on packet sizes, connection reuse, TLS, compression, retransmissions and the path through proxies, load balancers and service meshes.
Rather than assuming one universal overhead percentage, measure representative traffic or use a conservative, documented allowance when measurements are unavailable. Confirm whether the metric you are using already includes protocol overhead; otherwise it is easy to count it twice.
Compression can reduce transmitted bytes for compressible responses, but it consumes CPU and may provide little benefit for already-compressed formats. Caching can reduce repeated origin traffic, but cache misses and invalidations still need to be considered. These are workload characteristics, not free capacity.
5. Map traffic to the actual network path
An application request may cross several network boundaries:
- Browser or client to edge/CDN.
- Edge to load balancer or ingress.
- Ingress to application pods or virtual machines.
- Application to database, cache, message broker or external API.
- Service-to-service traffic between availability zones or regions.
Estimate each path separately. A single user request can generate multiple internal calls, so external bandwidth alone may significantly understate the traffic inside a cluster.
For Kubernetes and AKS environments, consider ingress and egress, pod-to-pod traffic, node-level interfaces, cross-zone traffic, service-mesh sidecars where present, and connections to managed services. Validate the limits and billing model for the actual cloud resources rather than assuming every network boundary has the same capacity.
For high-volume systems, draw the path and record which components share an interface or quota. This makes it easier to see when several individually reasonable workloads compete for the same link.
6. Identify the bottleneck before adding capacity
The network is only one part of the request path. A service can have available bandwidth while response latency rises because the application is CPU-bound, a database pool is exhausted, a cache is overloaded or consumers are falling behind.
Correlate network measurements with:
- Request rate, response size and latency percentiles.
- Interface throughput, errors, drops and retransmissions.
- CPU and memory utilization on the sending and receiving workloads.
- Connection counts, connection churn and load-balancer behavior.
- Database query latency and connection-pool saturation.
- Message-broker lag and retry rates.
- External dependency latency and failure rates.
A capacity change should address the observed constraint. Increasing network bandwidth will not fix a serialized database operation; adding application replicas may not help if they all compete for the same constrained dependency.
7. Plan headroom and failure scenarios
Do not plan for a system to operate continuously at its theoretical maximum. Leave room for traffic bursts, workload growth, maintenance, retries and partial failures. The right headroom depends on workload variability, recovery objectives, scaling time and the cost of overprovisioning.
Evaluate at least three scenarios:
- Expected peak: the busiest representative interval you expect to support.
- Growth case: a documented increase in traffic or payload size over the planning horizon.
- Degraded case: one instance, node or zone is unavailable and traffic shifts to the remaining capacity.
For each scenario, calculate or measure the expected load on the constrained path and identify the operating margin. If autoscaling is part of the plan, include how long it takes to detect load, schedule new capacity, start the workload and make it ready. Autoscaling cannot instantly absorb every sudden burst.
Capacity headroom is not a substitute for resilience testing. It is a planning assumption that must be validated against failure behavior and service objectives.
8. Validate the estimate with a representative load test
A spreadsheet is a useful starting point, but a load test reveals behavior the formula cannot capture. Design a test that reflects the real request mix, payload distribution, connection reuse, authentication and downstream calls.
Increase load gradually and observe where latency or errors begin to rise. Include a steady-state period, a peak burst and—where appropriate—a recovery test after load drops. Avoid generating test traffic against production systems without an approved test plan and safe limits.
Record the tested configuration and results so the next estimate can use evidence rather than assumptions. If the test does not resemble real traffic, its maximum RPS is not a dependable production capacity figure.
9. A repeatable calculation checklist
Before recommending an interface, node pool or cloud capacity change, confirm that you have:
- A defined workload and planning horizon.
- Average and peak request rates.
- Request and response payload sizes.
- A separate estimate for inbound and outbound traffic.
- Internal service-to-service traffic included.
- Explicit assumptions for protocol overhead and compression.
- A map of shared links, quotas and network boundaries.
- Correlated metrics to identify the actual bottleneck.
- Expected-peak, growth and degraded-capacity scenarios.
- A representative load test and a documented safety margin.
If a key input is unknown, state the uncertainty and gather telemetry. A precise-looking number based on unverified assumptions is less useful than a range whose limitations are understood.
Closing perspective
Network infrastructure capacity planning is a workload exercise, not just a bandwidth calculation. Request rate and payload size provide a first estimate, but concurrency, traffic shape, internal calls, protocol behavior, shared dependencies and failure scenarios determine whether the estimate is useful in production.
Start with measured behavior, make assumptions visible, model the busiest relevant path, and validate the result under realistic load. Then revisit the model as traffic and architecture evolve.
For a related hands-on starting point, use the System Design Capacity Calculator to explore workload estimates, and read the Kafka event-driven notification architecture guide for the impact of asynchronous processing and downstream consumers.
Try the capacity model, then validate it
Use the System Design Capacity Calculator as a quick way to explore workload assumptions. Treat the output as a planning aid, not a capacity guarantee: the result is only as reliable as the request-rate, payload-size, concurrency, peak-factor, and headroom inputs supplied.
For a reviewable estimate, record the inputs alongside the result:
| Input | What to record | Why it matters |
|---|---|---|
| Request rate | Average and relevant peak RPS | Daily averages can hide short bursts |
| Payload size | Typical and large-response sizes | Large responses can dominate outbound bandwidth |
| Concurrency | Active users and open connections | User counts alone do not predict request load |
| Traffic pattern | Peak windows, retries, scheduled work | Bursts and retries can amplify demand |
| Headroom | Explicit growth and degraded-capacity assumptions | A nominal estimate should not assume every component is always available |
| Validation | Load-test profile and observed bottlenecks | The model must be checked against measured behavior |
Example review questions
Before using an estimate to make an infrastructure decision, ask:
- Are request and response traffic calculated separately?
- Does the estimate include service-to-service traffic and shared network paths?
- Are payload sizes representative, including larger responses?
- Is the assumed peak factor based on telemetry or clearly labelled as an assumption?
- Has the workload been tested safely under a representative request mix?
- Is the limiting resource actually network throughput, rather than CPU, database latency, connection limits, or a downstream dependency?
If these answers are unknown, keep the estimate provisional and collect measurements before committing to a production size.
Related architecture and reliability guides
Capacity is only one part of operating a system. Read the Kafka event-driven notification architecture guide for asynchronous workload considerations and SLO and error-budget planning for connecting capacity and performance decisions to reliability objectives.
For a hot-key workload where total RPS hides per-auction contention, use the Auction Contention Estimator alongside the System Design Capacity Calculator. The first models a serialized auction path; the second helps estimate broader platform traffic and storage.