A connection pool is not a queue that should be made as large as possible. It is a concurrency control between application work and a database with finite CPU, memory, I/O and lock capacity. The useful question is how much concurrent database work the workload needs—and how much the database can handle safely.
Oversized pools can let every application replica open more database sessions than the database can execute efficiently. Undersized pools can leave application requests waiting even when the database has headroom. The fix is not a universal pool-size formula: it is to combine a connection budget, measured connection hold time, expected transaction rate and a controlled load test.
This guide shows a repeatable way to make that decision. The accompanying Database Connection Pool Pressure Estimator models the basic arithmetic in your browser.
Start with the database connection budget
First establish a safe connection budget for the application being sized. Do not simply copy the database server’s maximum connection setting into every application pool.
For PostgreSQL, max_connections limits concurrent connections, and increasing it also increases resource allocation. Reserve capacity for administration, migrations, monitoring, background jobs, other services and emergency access before allocating a budget to this application. See the PostgreSQL connection settings documentation.
Then account for every application replica:
| Quantity | What it means |
|---|---|
| Safe application connection budget | The maximum number of database connections allocated to this workload after other consumers and reserves are accounted for. |
| Application replicas | The maximum number of instances that may run at once, including rollout surge or autoscaling headroom where relevant. |
| Pool size per replica | The maximum database connections one instance can open. |
| Configured pool slots | Replicas multiplied by the per-replica maximum. |
| Effective safe ceiling | The smaller of configured pool slots and the application’s connection budget. |
For example, six replicas with a maximum pool of 20 can collectively request up to 120 database connections. If the application has been allocated only 90 safe connections, the pool configuration is oversubscribed even if each individual instance looks reasonable. A rolling deployment that temporarily runs extra replicas can make that gap worse.
Use the maximum replica count that can coexist during a deployment or scaling event—not only the steady-state count. If two services, worker processes or scheduled jobs use separate pools, include their budgets too.
Estimate average concurrency from measured work
A useful first estimate comes from Little’s Law:
average concurrent work = arrival rate × average time in the system
For a database connection pool, use the rate of transactions that actually acquire a connection and the average time a connection is checked out. If a workload performs 250 database transactions per second and holds a connection for an average of 180 milliseconds:
250 transactions/sec × 0.180 sec = 45 average concurrent connections
This is an average, not a guarantee that 45 connections will always be sufficient. Averages hide bursts, long-tail queries, lock waits, uneven request mixes and slow external work accidentally performed while a connection is held.
The checkout duration matters more than a single query’s execution time if the application keeps the connection checked out across several statements or the entire transaction. Measure the real checkout-to-release interval. Do not substitute HTTP requests per second unless the relationship between requests and connection checkouts is known.
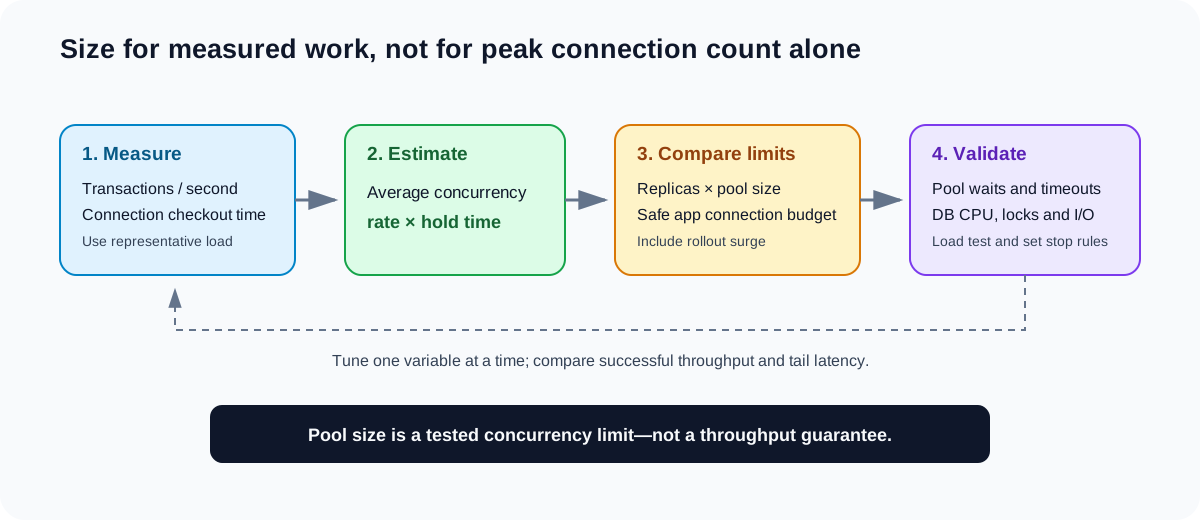
Worked example: six application replicas
Suppose a service has the following measured and planned values:
- Safe database connection budget allocated to the service: 120.
- Maximum application replicas, including rollout overlap: 6.
- Maximum pool size per replica: 20.
- Sustained database transaction rate: 250 per second.
- Average connection checkout duration: 180 ms.
- Planning burst multiplier: 1.5.
- Target pool utilization: 70%.
The configured pool slots are:
6 replicas × 20 connections = 120 configured slots
Average concurrent work is 45 connections. Applying the simple 1.5 burst multiplier gives a planning estimate of 67.5 concurrent connections. Seventy percent of the effective 120-slot ceiling is 84 connections, so this example remains below the target concurrency budget.
The corresponding baseline transaction rate at that target is approximately:
84 ÷ (0.180 sec × 1.5) = 311 transactions/sec
This is a planning estimate, not a throughput promise. It assumes the checkout duration remains representative and that the burst multiplier is a reasonable way to express the peak scenario. A database can saturate on CPU, locks, storage or query plans before it reaches the connection ceiling.
Try the same numbers in the Database Connection Pool Pressure Estimator. Change the replica count as well as the pool size: doubling replicas can double the maximum number of potential connections without changing the database’s capacity.
Why a larger pool can make latency worse
More open connections do not necessarily mean more useful work. When too many queries compete for CPU, storage, locks or memory, additional concurrency can increase context switching, queueing and contention. A large pool can also allow an application burst to reach the database all at once instead of applying backpressure at the application boundary.
The HikariCP pool-sizing guidance explains why small, measured pools can outperform very large ones. Treat its examples and formulas as hypotheses to test against your own database, query mix and hardware—not as a fixed number to copy across products.
A sensible tuning loop is:
- Record a baseline at representative load: throughput, p50/p95/p99 latency, database CPU, active sessions, lock waits, pool wait time and timeout counts.
- Change one pool or workload variable at a time.
- Run the same workload long enough to include warm-up and steady-state behaviour.
- Compare successful throughput and tail latency, not just how many connections are open.
- Stop increasing concurrency when throughput flattens while latency, queueing or resource pressure rises.
If the pool is frequently exhausted while the database is mostly idle, investigate connection leaks, slow application code holding connections, too-low pool limits or uneven routing. If the pool is exhausted and database CPU, lock waits or I/O are already high, adding connections may worsen the bottleneck.
Keep the connection checkout interval short
Acquire a connection only when database work is ready to begin, and release it as soon as the transaction is complete. Avoid holding a transaction open while calling a remote API, waiting for a message broker, sending an email or waiting for a user-facing response.
Long-lived transactions can keep locks and snapshots alive, increase contention and occupy a pool slot without making progress. If a workflow needs to publish an event after a database commit, consider a transactional outbox so the database transaction records the event intent and a separate publisher delivers it. The Kafka notification architecture guide covers this boundary and failure handling.
For PostgreSQL workloads with many short-lived client connections, a pooler such as PgBouncer may help separate client connections from database server connections. Pool mode changes the guarantees: transaction pooling can reuse a server connection after a transaction ends, but applications must not depend on session state that persists across transactions. Test prepared statements, session settings, temporary objects and transaction boundaries with the chosen configuration.
What to measure before changing production
A connection-count graph by itself is not enough. Capture these signals together:
| Signal | What it helps distinguish |
|---|---|
| Pool active, idle and maximum connections | Whether the application pool is actually exhausted. |
| Connection acquisition wait duration and timeout count | Whether requests are queuing before database work begins. |
| Connection checkout duration | Whether transactions or application code are holding connections too long. |
| Database active sessions and wait events | Whether the database is busy executing work or waiting on locks/I/O. |
| Database CPU, memory and storage latency | Whether the bottleneck is beyond the pool limit. |
| Successful transaction rate and p95/p99 latency | Whether a pool change improves useful throughput or merely adds contention. |
| Replica count during autoscaling and rollouts | Whether the aggregate connection ceiling changes unexpectedly. |
Define a stop condition before testing. For example, stop increasing concurrency if p99 latency or database resource pressure crosses the service’s operating limit, even if the pool still has room. Relate that threshold to your SLO and error-budget plan rather than tuning in isolation.
For broader workload assumptions such as requests per second, bandwidth and storage, use the System Design Capacity Calculator and the network infrastructure capacity planning guide. If the workload runs on AKS, include the maximum replica count and rollout surge from the production upgrade preflight checklist. Origin access and network boundaries still matter; see the Cloudflare and Nginx origin security guide.
A practical decision rule
- If aggregate configured pool slots exceed the allocated database connection budget, reduce per-replica pool size, cap replica growth, or introduce a suitable pooler before increasing the database limit.
- If the pool is saturated but the database is underutilized, inspect acquisition waits, connection leaks, transaction duration and routing before changing the maximum.
- If the database is saturated, test query plans, indexing, lock contention, caching, batching and workload admission before increasing concurrency.
- If load tests show stable throughput and latency headroom, adjust gradually and keep the measured baseline.
The estimator deliberately reports connection demand and headroom rather than pretending to predict queueing delay or database throughput precisely. Its output is a starting point for a controlled test. The final pool setting should be supported by measured workload behaviour, a safe aggregate connection budget and an explicit rollback threshold.